Washington Nationals: The franchise all-time bracket

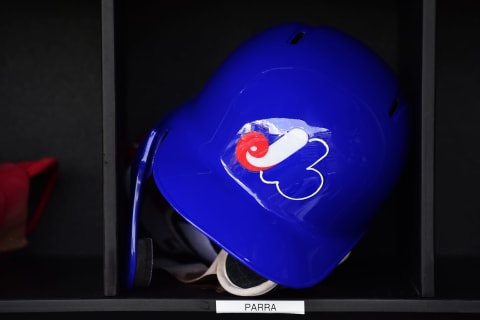
The Washington Nationals are the defending champions, but they may not be the best team in franchise history. Several teams of recent vintage can challenge.
The 2019 Washington Nationals are the defending World Series champions, and that distinction alone makes their 2019 club a worthy candidate as the best team in franchise history.
At the same time, the Nats have had several strong entrants in recent seasons, a byproduct of the most recent decade easily ranking as the best in franchise history.
More from Call to the Pen
- Philadelphia Phillies, ready for a stretch run, bomb St. Louis Cardinals
- Philadelphia Phillies: The 4 players on the franchise’s Mount Rushmore
- Boston Red Sox fans should be upset over Mookie Betts’ comment
- Analyzing the Boston Red Sox trade for Dave Henderson and Spike Owen
- 2023 MLB postseason likely to have a strange look without Yankees, Red Sox, Cardinals
The single common flaw of those pre-2019 teams was an inability to come through in the big post-season moments.
Putting together a Nationals-Expos all-time bracket begins with the consideration of the most recent decade. Aside from the 2019 champions, at least four other representatives of the decade can be included without doing any damage to the franchise’s overall history.
The four best non-champions are the teams of 2012, 2014, 2016, and 2017.
That leaves three additional spots for the pre-2010 era. There are two obvious candidates, the 1981 Expos that played for the National League championship and the ill-fated 1994 team. That club, fans will recall, held a comfortable lead in the NL East when the season was aborted due to the strike.
The final position goes to the best Expos-Nats team not already included, the 1996 Montreal club.
Related Story. Boston Red Sox: The franchise all-time bracket. light
The format is identical to previous bracket challenges. Each matchup in the tournament is decided based on seven criteria. You can think of each as a ‘game,’ the winner of four games advancing. The seven criteria are:
- Game 1: Regular season winning percentage.
- Game 2: Post-season winning percentage
- Game 3: Team OPS+
- Game 4: Team ERA
- Game 5 (if necessary): Team WAR
- Game 6 (if necessary: Fielding percentage above the league average for the season in question.
- Game 7 (if necessary): The standard for Game 7 is Hall of Famers or likely future Hall of Famers.
Washington Nationals: The All-Time Bracket
No. 1 vs. 8 seed
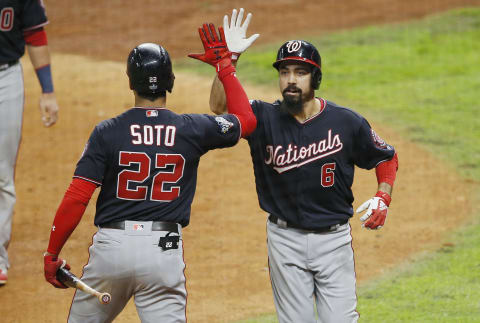
The 2019 champions deserve the top seed even if they only qualified as the National League’s first wild card. From that launching pad, they beat Milwaukee in the wild card game, then went on to eliminate the Los Angeles Dodgers, St. Louis Cardinals and Houston Astros, the latter in seven games.
Third baseman Anthony Rendon and left fielder Juan Soto led the offense. Rendon batted .319 with 34 home runs and 126 RBIs, while Soto backed him up with 34 homers and 110 RBIs.
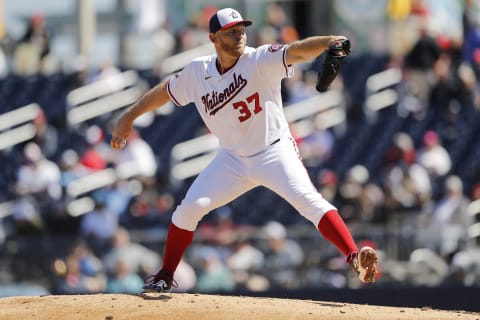
On the mound, Stephen Strasburg, Patrick Corbin, and Max Scherzer were a dynamic top three. They combined for a 43-20 record in 93 starts embracing 583 innings, striking out 732 in the process.
The 1996 Expos operated in an uncertain post-strike environment, yet still managed to win 88 games and finish second in the NL East. They were eight games behind the division champion Atlanta Braves, but only two behind the wild card Los Angeles Dodgers.
Only in the beginning processes of the dismantling that would eventually destroy the franchise, the Expos still had Moises Alou. He hit 21 homers and drove in 96 runs. Left fielder Henry Rodriguez hit 36 home runs and drove in 103.
Twenty-one year old Vlad Guerrero was starting the development process that would make him a franchise star and a Hall of Famer.
Pedro Martinez, not yet traded to Boston, was 13-10 in 33 starts. Jeff Fassero led the staff with 15 wins and a 3.30 ERA. Mel Rojas closed out 36 saves.
Related Story. Miami Marlins: The franchise all-time bracket. light
Game 1: The 1996 team had a .543 regular-season percentage. The 2019 Nats played .574 ball in the regular season.
Game 2: The 2019 team won the World Series with a .705 post-season percentage. The 1996 Expos did not qualify for post-season play.
Game 3: In 2019 the Nationals lineup produced a 100 OPS+. The 1996 Expos managed only a 91 OPS+.
Game 4: Seeking a sweep, the 2019 Nationals send out a pitching staff that presented a 108 ERA+. But the Martinez-led 1996 team had a 115 ERA+, so the series continues.
Game 5: The 1996 Expos had a 35.6 WAR. That won’t keep up with 2019’s 46.1 WAR.
Result: 2019 in five games
Washington Nationals: The All-Time Bracket
No. 4 vs. 5 seed
The 2017 and 2014 Nationals were similar teams that shared similar fates. Both were upset in the division round.
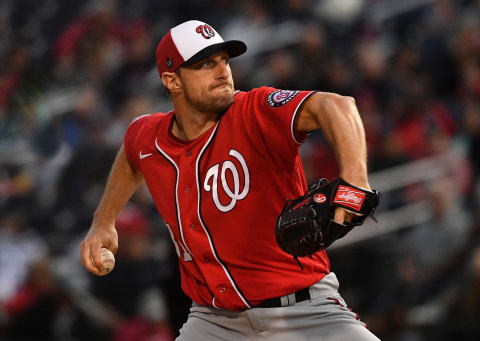
The 2017 club was managed by Dusty Baker, winning the East by 20 games before running afoul of the Chicago Cubs in the division round. Bryce Harper batted .319 with 29 home runs and 87 RBIs, and Anthony Rendon emerged as a star, hitting .301 with 25 homers and 100 RBIs. First baseman Ryan Zimmerman turned in a .303, 36 homer, 108 RBI season, and second baseman Daniel Murphy hit 23 home runs while driving in 93.
The Nats could also pitch. Scherzer was 16-6, Strasburg 15-4, and Gio Gonzalez 15-9, all with sub-3.00 ERAs.
The 2014 Nats also won the East comfortably before bowing out, in their case to the San Francisco Giants. Matt Williams managed that club.
The central cast was only partly changed. Harper was limited by injuries to 395 plate appearances, batting .273 with 13 home runs. Rendon hit .287 with 21 homers and 83 RBIs,
First baseman Adam LaRoche led in both power categories, producing 26 home runs and 92 RBIs. Injuries also slowed Zimmerman.
The Nats featured a rotation of five 10-game winners, Doug Fister leading the way at 16-6. Strasburg made 34 starts with a 14-11 record.
Related Story. Tampa Bay Rays: The franchise all-time bracket. light
Game 1: The 2014 team put together a 96-66 regular-season record for a .593 percentage. The 2017 club was 97-65, .599.
Game 2: The 2014 Nats only played .250 post-season ball, losing to San Francisco in four games. The 2017 Nats took the Cubs to a fifth NLCS game, giving them a .400 post-season percentage and a 2-0 series lead.
Game 3: Neither team was an offensive powerhouse, but at a 99 OPS+ the 2017 team fared better. The 2014 Nats only got to 96.
Game 4: The 2017 Nats had a 116 staff ERA+. The 2014 team lacked the name power of Scherzer, but it achieved a 124 ERA+, good enough to keep the series going.
Game 5: Both teams totaled identical WARs of 47.6. That takes us to the tie-breaker, highest individual WAR. For the 2017 team that was Scherzer at 7.2. In 2014 Rendon led the way, but he only got to 6.5.
Result: 2017 in five games
Washington Nationals: The All-Time Bracket
No. 2 vs. 7 seed
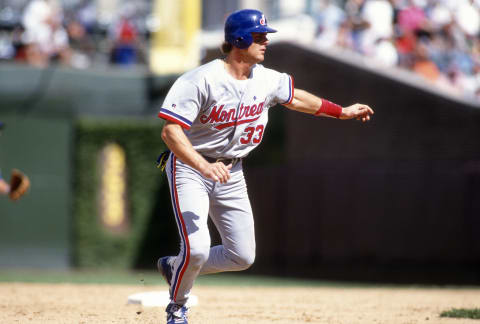
This series features the two best teams in Expos history, the 1981 and 1994 clubs.
The 1981 Expos won the post-strike portion of that season, then eliminated the first-half champion Philadelphia Phillies in an NLCS qualifier. In the NLCS, they lost to the Dodgers on Rick Monday’s ninth-inning home run off ace Steve Rogers.
Rogers was one of the dominant mound forces of the era. He won 12 of 20 decisions in that split season, pitching 160 innings. Scott Sanderson, Ray Burris, Bill Gullickson and Charlie Lea were other steady contributors.
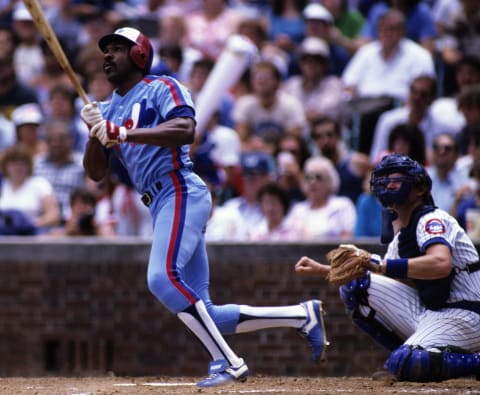
The every-day lineup was a Montreal Who’s Who. Left fielder Tim Raines and first baseman Warren Cromartie hit .304, center fielder Andre Dawson added .302 with 24 home runs, and catcher Gary Carter led the team with 68 RBIs.
The 1994 club held a six-game lead in the East when the strike was called. At the time, Moises Alou was batting .339 with 22 home runs and 78 RBIs, right fielder Larry Walker was at .322 with 19 and 86, and shortstop Wil Cordero had 63 RBIs.
Martinez and Ken Hill formed an imposing top two on the mound, combining for a 27-10 record in 46 starts. John Wetteland saved 25 games.
Baltimore Orioles: The franchise all-time bracket. light. Related Story
Game 1: The 1994 Expos had a 74-40, .649 record at the time of the strike. The 1981 team played 60-48, .556 ball. That’s a win for 1994.
Game 2: Since the 1994 expos were denied a chance to play in post-season, this game goes in the books as a forfeit for the 1981 team, which had a .500 post-season percentage.
Game 3: The 1981 Expos only produced a 94 OPS+. The 1994 team had a 101 OPS+.
Game 4: In 1994 Expos pitchers compiled a 119 ERA+. The 1981 staff only reached 107.
Result: 1994 in five games
Washington Nationals: The All-Time Bracket
No. 3 vs. 6 seed
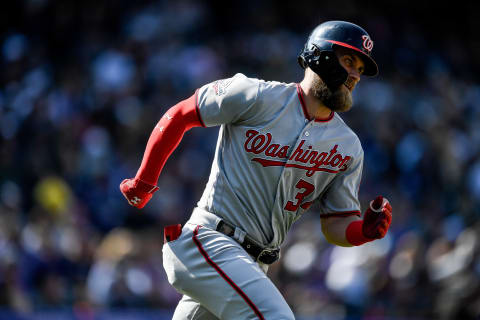
The 2012 Nationals beat Atlanta by four games in the NL East but lost the division series to St. Louis. Harper, only 19, hit .270 with 22 home runs. LaRoche hit 33 homers and drove in 100 runs, and Zimmerman – playing third base – added 25 and 95.
At age 23, Strasburg was a 15-game winner in 28 starts. But Gonzalez was the staff ace, with a 21-8 record and 2.89 ERA in 32 starts. Tyler Clippard saved 32 games.
The 2016 team may have been the best of the recent Nationals clubs, but it had the misfortune to run into the Los Angeles Dodgers. The Nats came in as NL East champions by eight games but lost that division series in five, The series was decided on a Dodger seventh-inning rally after Baker removed Scherzer.
Scherzer was a 20-game winner with a 2.96 ERA, and Strasburg backed him up with a 15-4 season in 24 starts.
Harper had one of his worst seasons, hitting only .243. But he still produced 24 home runs and 86 RBIs. He was one of a half dozen Nationals with 20 or more home runs. Daniel Murphy’s 104 RBIs powered the offense.
Related Story. Atlanta Braves: The definitive franchise all-time bracket. light
Game 1: The 2012 team finished 98-64 .605, three games better than 2016’s 95-67 .586.
Game 2: Both teams played .400 post-season ball. But the tie-breaker goes to the 2016 team, which out-scored its post-season opponents by three runs. The 2012 team was out-scored by 16 runs in post-season.
Game 3: The 2012 Nats had a 101 OPS+, five points better than 2016.
Game 4: The 2016 team’s 122 ERA+ is two points better than 2-12’s 120. This series is even at 2-each.
Game 5: The 2012 Nationals amassed 45.8 WAR, 1.5 more than 2016’s 44.3.
Game 6: The 2012 Nationals fielded .988, four points better than the National League average. In 2012 the Nats fielded .985, just two points better than the league average.
Game 7: Neither team has a Hall of Famer yet, and their candidates logically overlap. That takes us to the Game 7 tie-breaker, All-Stars. The 2012 team produced four of them: Harper, Strasburg. Gonzalez and infielder Ian Desmond. The 2016 team included five All-Stars, Harper, Scherzer, Strasburg, catcher Wilson Ramos, and infielder Daniel Murphy.
Result: 2016 in seven games
Washington Nationals: The All-Time Bracket
The Semi-finals
2019 vs. 2017
Game 1: The 2019 Nats only reached post-season as the wild card, based on their 93-69 record and .574 percentage. The 2017 team may not have advanced as far in post-season, but it did win four more regular-season games with a .599 percentage.
Game 2: The 2019 team’s .705 percentage easily outpaces 2017’s .400.
Game 3: In 2019 the Nats had a 100 OPS+, one point better than 2017’s 99.
Game 4: The 2017 team had a 116 ERA+, eight points better than 2019’s 108. The series is even at two games each.
Game 5: In 2017 the Nationals had a 47.6 WAR. The 2019 team only managed 46.1 WAR.
Game 6: The 2019 Nats fielded .985, four points better than the league average. In 2017 the Nats also fielded .985, but that only equaled the league average.
Game 7: Again there is no point in looking at potential Hall of Famers, which are likely identical. So we go to All-Stars. The 2017 team placed Zimmerman, Murphy, Scherzer, and Harper on the team. The 2019 Nats only landed two spots, Rendon and Scherzer.
Result: 2017 in seven games
Related Story. New York Mets: The definitive franchise all-time bracket. light
1994 Expos vs. 2016 Nats
Game 1: The 1994 Expos had a .649 percentage in the shortened regular season. The 2016 team played .586 ball.
Game 2: The 1994 team was deprived of a post-season opportunity, forfeiting this game to 2016’s .400 post-season record.
Game 3: In 2016 the Nationals had a 96 OPS+. That’s five points worse than 1994’s 101.
Game 4: The 2016 staff’s ERA+ was 122. In 1994 the staff ERA+ reached 119, three points short. This series is even at two games each.
Game 5: The 1994 Expos compiled 35.7 WAR in their shortened season. The 2016 team reached 44.3 WAR.
Game 6: In 2016 the Nats fielded .988, four points better than the National League average. The 1994 Expos fielded .979, one point worse than the league average.
Result: 2016 in six games
Washington Nationals: The All-Time Bracket
Championship
So the Washington Nationals bracket comes down to back-to-back post-season disappointments.
More from Washington Nationals
- MLB trade deadline: Nationals and Mets for sale, plus wish lists for Phillies, Braves, Marlins
- MLB trade talk: 5 contending teams who should trade for Nationals 3B Jeimer Candelario
- Mike Rizzo and the Washington Nationals front office: A mid-season grade
- Washington Nationals: Jeimer Candelario is having a resurgent season
- Braves, Nationals, Mets, Marlins, Phillies: The good, bad and injured in the NL East
2016 vs. 2017
Game 1: The 2016 team had a 95-67 .586 record. The 2017 team was 97-65 .599, two games better.
Game 2: Both teams played .400 post-season ball. The 2016 Nats out-scored their opponents by three runs. The 2017 team also out-scored its opponents, but by only two runs.
Game 3: In 2016 the Nationals had a 96 OPS+. The 2017 team got to 99.
Game 4: The 1027 Nats succeeded on a 116 staff ERA+. The 2016 staff did even better, reaching 122. The series is tied at two games each.
Game 5: The 2016 team had a 44.3 WAR. In 2017 the team WAR was 47.6, about two points better.
Game 6: The 2017 team fielded .985, equaling the league average. The 2016 club fielded .988, four points better than the league average.
Next. A-Rod wants to give back during COVID-19 pandemic. dark
Game 7: Once again we revert to All-Stars due to the impossibility of sorting out Hall of Fame possibilities. The 2017 team had four of them: Harper, Murphy, Zimmerman, and Scherzer. The 2016 team had Harper, Murphy, and Scherer. Zimmerman did not make it, but catcher Ramos and pitcher Strasburg both did, giving it five and the narrowest of victories.
Result: 2016 in seven games