MLB Power Rankings: Seattle still surging

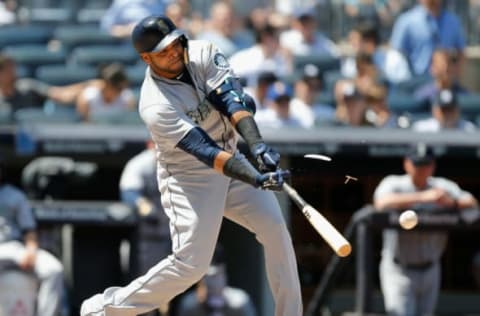
With the season just past the halfway point, who are the movers and shakers in the MLB Power Rankings?
While the All-Star Break kind of feels like the halfway point, it’s usually a week or two beyond the actual halfway point of 81 games (in a 162-game season). MLB teams went past the 81-game mark earlier this week and pennant races are sorting themselves out a bit, at least in the American League.
The AL has four teams on pace for 100 or more wins and none of the four are in the AL Central. The Red Sox, Yankees, Astros and Mariners are the behemoths right now, although one of the four is not like the other. The Red Sox, Yankees and Astros all have run-differential of +111 or more. The Mariners’ run-differential is +22.
Still, the Mariners have banked 54 wins in 85 games and are just a half-game behind the Astros in the AL West. Their one-run record is up to 26-11 and they are 8-0 in extra innings. Despite running into a detour in Boston and New York, they got back on the expressway against Baltimore and Kansas City.
In the AL East, the Red Sox and Yankees played three games in New York over the Weekend and none were remotely close. The Yankees won 8-1 on Friday and 11-1 on Sunday. On Saturday, they got pummeled 11-0. This rivalry will likely be at its most heated in September when they play each other six times in the season’s final 12 games, with the last three games of the season being in Boston.
Then there’s the AL Central, where Cleveland figures to run away from a division in which they’re the only team with a winning record. Detroit was a nice story a couple weeks ago. Then they lost 11 straight games and now they are who we thought they were.
In the National League everyone keeps waiting for the Washington Nationals, Chicago Cubs and Los Angeles Dodgers to take command of their respective divisions but the Atlanta Braves, Milwaukee Brewers and Arizona Diamondbacks refuse to concede. The Philadelphia Phillies and San Francisco Giants aren’t going down without a fight either.
At least the NL has a wild card race. Six teams are within 5.5 games of the second wild card spot. The AL wild card race is basically the Oakland A’s hoping to make up eight games on the Seattle Mariners. Every other team is at least 11 games back of the M’s for the second wild card spot.
So with two weeks left until the All-Star break, let’s look at the Power Rankings. These rankings are based on a special formula that includes each team’s actual record, run-differential, expected record and how they’ve played over the last 30 days. I’ve included that information with each team, along with where they ranked two weeks ago in parenthesis.

#30 (29) Kansas City Royals, 25-58, .301 (24-59 Expected Record)
-158 run-differential, 5-21 over the last 30 days
How bad are the Royals? They have the second-worst record in baseball, have won just three of their last eighteen games, and have the worst ERA and the second-worst offense in baseball (81 wRC+, meaning they are 19 percent below average on offense after adjusting for league and park effects). They could challenge for the worst record in franchise history. They were 56-106 back in 2005.
#29 (30) Baltimore Orioles, 24-59, .289 (28-55 Expected Record)
-123 run-differential, 6-20 over the last 30 days
Not to be totally outdone by the Royals, the Baltimore Orioles have the worst offense and worst defense in baseball. Their pitching, primarily the bullpen, has been good enough to keep them just out of the bottom spot in the Power Rankings. When they trade Manny Machado, they might have to expand their Kids Cheer Free program to Everyone Cheers Free.
#28 (27) Chicago White Sox, 29-54, .349 (30-53 Expected Record)
-109 run-differential, 12-17 over the last 30 days
One of the early bright spots for the White Sox was third baseman Matt Davidson. In his first 42 games, he had a .368 OBP and .521 SLG. The big change was a much-improved 15.8 percent walk rate and a slightly improved 32.2 percent strikeout rate Then he went on the DL. Since he returned from the DL, he’s walked 10.1 percent of the time and struck out 44.9 percent of the time.
#27 (24) New York Mets, 33-48, .407 (34-47 Expected Record)
-58 run-differential, 6-20 over the last 30 days
Rumor has it that Jacob deGrom is fed up with losing. That’s not surprising. He’s started 17 games this year and has a 1.84 ERA, yet his record is just 5-4. The Mets have won just two of their last twelve games and GM Sandy Alderson is taking a leave of absence to undergo cancer treatment. The front office has until the end of the month to decide whether to blow things up and trade deGrom or Noah Syndergaard or hold on to them and continue to be the Mets we’ve come to know and love.
#26 (28) Miami Marlins, 34-51, .400 (30-55 Expected Record)
-110 run-differential, 14-14 over the last 30 days
If the Power Rankings included attendance figures, the Marlins would be on the very bottom. They averaged 20395 fans per game last year. This year, they’re at 9986, or 49 percent of last year’s total. The next-lowest teams are the Royals and Blue Jays, both at 73 percent of last year’s attendance.

#25 (16) Detroit Tigers, 33-48, .435 (36-49 Expected Record)
-54 run-differential, 10-18 over the last 30 days
Two weeks ago, the Detroit Tigers were just 2.5 games out of first place. Then they lost 11 of 12 games and now sit 9.5 games out of first. That’s why they’ve dropped nine spots in the Power Rankings.
#24 (18) San Diego Padres, 37-49, .430 (35-51 Expected Record)
-66 run-differential, 12-15 over the last 30 days
If the Padres trade reliever Brad Hand before the All-Star break, who will be their token All-Star?
#23 (21) Minnesota Twins, 35-45, .438 (36-44 Expected Record)
-34 run-differential, 13-14 over the last 30 days
The Twins were supposed to be the one team in the AL Central that might challenge Cleveland. Now it looks like they won’t be. The wild card looks like a distant memory, as well. When will Brian Dozier be traded? Does anyone still want Brian Dozier?
#22 (25) Texas Rangers, 38-47, .447 (38-47 Expected Record)
-46 run-differential, 14-11 over the last 30 days
The Rangers have gone 11-3 over their last 14 games but still sit 16.5 games out in the AL West and 16 games behind the second wild card team. Rumor has it that Cole Hamels and his $23.5 million contract is on the trading block. You’d have to think Adrian Beltre ($18 million) is right there with him.
#21 (23) Colorado Rockies, 41-43, .488 (37-47 Expected Record)
-46 run-differential, 11-16 over the last 30 days
It’s probably not surprising that one of the issues with the Rockies is their pitching at home in hitter-friendly Coors Field. Their ERA at home has jumped from 4.93 last year to 6.16 this year. On the road, they are nearly the same (4.09 in 2017, 4.01 this year).

#20 (26) Cincinnati Reds, 36-48, .429 (38-46 Expected Record)
-34 run-differential, 15-11 over the last 30 days
The Reds jumped up six spots on the Power Rankings by going 10-3 over the last two weeks. This included a four-game sweep of the Cubs and winning two of three against the Braves. They capped their week by winning the final two games of a four-game series with the Brewers. One of the keys to their recent success is Joey Votto, who hit .286/.464/.524 over the last two weeks.
#19 (22) Toronto Blue Jays, 39-44, .470 (37-46 Expected Record)
-39 run-differential, 14-12 over the last 30 days
Kevin Pillar started the season by hitting .316/.363/.549 in his first 35 games. Since then, he’s hit .201/.221/.310. It would be nice if he could just settle somewhere in between awesome and awful. At least his glove continues to impress.
#18 (19) Pittsburgh Pirates, 40-43, .482 (41-42 Expected Record)
-6 run-differential, 10-16 over the last 30 days
The Pirates are such a tease. They recently went past the mid-season 81-game mark and are now 40-43 on the season. That’s pretty much where their fans should have expected them to be at this point. The problem is, they started out the year 26-17 and gave their fans hope, only to dash it on the rocks.
#17 (20) Tampa Bay Rays, 42-41, .506 (42-41 (Expected Record)
+5 run-differential, 13-14 over the last 30 days
In case you’re not paying attention to the Tampa Bay Rays (because why would you?), you might be interested to known they’ve won eight of their last nine games. All of those games have come against the Yankees, Nationals and Astros and the one game they lost was a 1-0 heartbreaker. Their unusual pitching staff held those teams to just 14 runs in those nine games.
#16 (13) St. Louis Cardinals, 42-40, .512 (42-40 Expected Record)
+6 run-differential, 12-15 over the last 30 days
While the Cardinals sneakily sit right in the middle of a group of teams very much alive in the wild card race, they’ve had a couple players with impressive achievements recently. On Saturday, Yadier Molina became the fifth player in franchise history to play in 1800 games with the team. A few days before that, Matt Carptenter had a 5-for-5 night that included two home runs.

#15 (17) San Francisco Giants, 45-40, .529 (41-44 Expected Record)
-12 run-differential, 18-10 over the last 30 days
The Giants are just 2.5 games out in the NL West despite having Johnny Cueto and Jeff Samardzija on the DL and being without Madison Bumgarner for most of the season. In their place, the Giants are getting good pitching from guys like Andrew Suarez (4.18 ERA, 3.56 FIP) and Dereck “Son of Pudge” Rodriguez (3.16 ERA, 3.34 FIP).
#14 (12) Los Angeles Angels, 43-42, .506 (44-41 Expected Record)
+17 run-differential, 13-14 over the last 30 days
More than half the season has been played and the Angels are 11 games out of the second wild card in the AL. This isn’t how they imagined it would be when they signed Shohei Ohtani and acquired Zach Cozart in the offseason. Both Ohtani and Cozart are on the DL now, but the team is still playing Albert Pujols (88 wRC+, -0.3 WAR), Luis Valbuena (69 wRC+, -0.4 WAR) and Kole Calhoun (22 wRC+, -1.0 WAR) regularly. They’re going to need another Mike Trout to make up for those drains on the offense.
#13 (10) Washington Nationals, 42-40, .512 (45-37 Expected Record)
+32 run-differential, 9-16 over the last 30 days
The Fangraphs projections still have the Nationals winning the NL East despite their current six game deficit to the Atlanta Braves. It’s easy to think the Braves will continue to lead the division but projections have been fairly accurate over the years.
#12 (14) Philadelphia Phillies, 45-37, .549 (42-40 Expected Record)
+6 run-differential, 13-14 over the last 30 days
If the season ended today, the Phillies would be the second wild card team in the NL. They’re doing this despite getting very little from the shortstop position. If any team could use Manny Machado, it’s the City of Brotherly Love.
#11 (15) Oakland Athletics, 46-39, .541 (43-42 Expected Record)
+8 run-differential, 17-10 over the last 30 days
The A’s have been on a tear lately, with 12 wins in their last 15 games. Suddenly, they’re the team that’s closest to the Mariners in the race for the second wild card. In their recent hot stretch, they’ve beat up on the Padres, White Sox and Tigers. They’ll play 10 of their next 12 games heading into the All-Star Break against Cleveland, Houston and San Francisco. We should know if they’re pretenders or contenders when this stretch is behind them.
#10 (7) Milwaukee Brewers, 48-35, .578 (47-36 Expected Record)
+47 run-differential, 12-13 over the last 30 days
After 83 games last year, the Brewers were surprise contenders and had a three game lead in the NL Central. They increased it to a 5.5 game lead by the All-Star break, but faltered in the second half and finished behind the Cubs. There was some criticism that they didn’t make a big trade to really make a strong push for the playoffs. One year later, you have to wonder if they’ll make that big trade. Can they take the Central?
#9 (8) Los Angeles Dodgers, 44-39, .530 (47-36 Expected Record)
+51 run-differential, 17-9 over the last 30 days
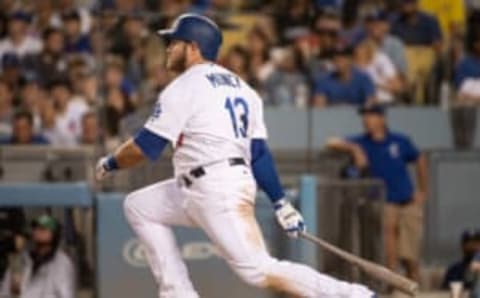
On a team with a payroll of $187 million and five players making $10 million or more, it’s minimum salary guys Max Muncy (.264/.606/.603, 171 wRC+, 2.6 WAR) and Ross Stripling (1.98 ER, 2.61 FIP, 2.2 WAR) who have been the team’s best players so far.
#8 (11) Cleveland Indians, 45-37, .549 (48-34 Expected Record)
+66 run-differential, 14-12 over the last 30 days
Cleveland has the lowest winning percentage of any division leader but the biggest lead over the second place team in their division. They are 25-13 against their division opponents and 20-24 against everyone else.
#7 (9) Arizona Diamondbacks, 47-37, .560 (49-35 Expected Record)
+54 run-differential, 19-9 over the last 30 days
Cancel the missing person report. Paul Goldschmidt has been found. Goldy hit .198/.320/.355 through his first 49 games. Since then, he’s hit .351/.444/.725. Since Goldschmidt got his groove back, the Diamondbacks have gone 22-14.
#6 (6) Atlanta Braves, 48-34, .585 (50-32 Expected Record)
+82 run-differential, 14-11 over the last 30 days
Keep your eyes on the Braves over the next two weeks. They face three division-leading teams—the Yankees, Brewers, and Diamondbacks—in 10 of their next 12 games. Can they hold onto their lead in the NL East as they head into the All-Star break?

#5 (4) Chicago Cubs, 47-35, .573 (52-30 Expected Record)
+99 run-differential, 16-12 over the last 30 days
Through their first 82 games last year, the Cubs were 41-41 and sat two games out of first in the NL Central. They went 51-29 from that point on and won the division by 5.5 games. It’s more likely than not that they do something similar this year.
#4 (5) Seattle Mariners, 54-31, .635 (45-40 Expected Record)
+22 run-differential, 19-9 over the last 30 days
After losing seven of ten games against the Red Sox and Yankees, the Mariners had the good fortune of playing their next seven games against the two teams at the very bottom of the power rankings. They swept the Orioles and Royals and are just a half-game back of the Astros.
#3 (3) New York Yankees, 54-27, .667 (51-29 Expected Record)
+111 run-differential, 18-9 over the last 30 days
With the trouble Sonny Gray is having lately, the Yankees are rumored to have interest in the Tigers’ Michael Fulmer. Until they make a trade for a starting pitcher, perhaps they can just start Gray on the road, where he has a 3.28 ERA and 2.69 FIP (compared to an 8.25 ERA and 6.60 FIP at home).
Live Feed class=inline-text id=inline-text-7
House That Hank Built
#2 (2) Boston Red Sox, 56-29, .659 (56-28 Expected Record)
+119 run-differential, 17-10 over the last 30 days
What a difference in free agency between MLB and the NBA. On the first day of NBA free agency, LeBron James signed with the Los Angeles Lakers. Last offseason, it took four months for J.D. Martinez to find a home in free agency. Sure, Martinez is no LeBron James, but he’s one of the best hitters in baseball and couldn’t find a job until after position players had already reported to spring training.
#1 (1) Houston Astros, 55-31, .640 (66-23 Expected Record)
+170 run-differential, 19-9 over the last 30 days
It’s kind of a bummer that the Astros haven’t played up to their run-differential. If their record matched their run-differential, they would be 63-23 and “on pace for” a 119-win season, which would beat the single-season wins record by three games. It’s crazy to think they could win 100-plus games and be a bit of a disappointment.
Next: Nats catching trade deadline targets
That’s the MLB power rankings for Monday, July 2nd, 2018. Do you have any disagreements? Someone too high? Someone too low? Comment below!!