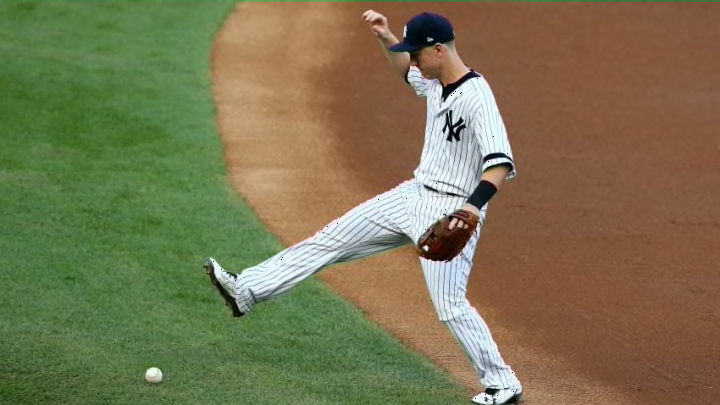
When reviewing the impact of plays on the game, how does an error affect baseball statistics that would normally occur immediately following that play?
What’s the emotional impact of an error? Okay, better question – what’s the impact of an error on baseball statistics?
Answer: About 18 percentage points in batting average, 22 points in on base average, and 19 points in slugging average.
That’s the result of a study of all 2,817 errors committed during the 2017 season.
The study found that major league pitchers whose teams erred behind them allowed hits at a .273 rate for the remainder of their work in that error-marred inning. That compares with the MLB-wide .255 2017 batting average.
Walk rates and slugging rates rose by similar amounts, from .324 to .346 for on base average and from .426 to .445 for slugging average.
The study encompassed every event occurring immediately following the commission of a fielding error. This included not just hits, bases on balls and batters retired, but wild pitches, passed balls, balks, stolen bases, caught stealing, runners retired on bases and defensive indifference. The tabulation continued until halted by one of two events: either the pitcher’s removal from the game or the end of the inning.
Post-error performance varied widely, however, when viewed on a team-by-team basis, suggesting that some teams’ pitching staffs responded to fielding misfortune far better than others.
The staffs of nine major league teams allowed base hits at higher than a .300 average immediately following an error committed behind them. Worst in that regard was the staff of the Minnesota Twins, who surrendered 48 base hits – six of them home runs – in 140 official at bats in those scenarios.
But Twins pitchers only had the fourth highest post-error slugging average against them. Worst were the Cincinnati Reds’ pitchers, whose 55 hits allowed included a dozen home runs and a dozen more doubled. Batters slugged .613 – 187 percentage points above the MLB average – following a Reds error.
At the other end of the spectrum, San Diego Padres pitchers allowed just 43 hits in 203 official at bats following an error. That translates to a .212 post-error batting average, 43 percentage points below the MLB average, and 36 percentage points behind the staff’s overall .248 batting average allowed.
Boston Red Sox pitchers held teams to the lowest post-error slugging average, allowing just seven extra base hits in 198 official post-error at bats. That translates to a .278 slugging average, 148 percentage points better than the MLB average in all situations for 2017
More from MLB News
- MLB Power Rankings: Atlanta Braves still on top with major shifting below them
- Caesars MLB Promo Code: Two Shots at Picking the World Series Winner!
- MLB Power Rankings: Atlanta Braves still on top amid a big shake-up in top 10
- DraftKings MLB Promo: Bet $5 on an Anytime Home Run, Win $150 Bonus GUARANTEED
- MLB Power Rankings: After MLB trade deadline, gap is closing on Atlanta Braves
Perhaps surprisingly, there was only a light correlation between a team’s ability to overcome its own errors and its winning percentage. Of the 10 teams that reached post-season play in 2017, four – the Red Sox, Astros, Dodgers and Nationals – held opponents to post-error batting averages that were lower than the overall MLB average. Three, however – the Twins, Colorado Rockies and Arizona Diamondbacks – allowed post-error batting averages that were more than 20 percentage points worse than the overall MLB average.
The study consisted of an average of 206 data points for each team. But that number, too, ranged widely, depending on the number of errors committed per team and the pitching staffs’ abilities to quickly quell trouble. Oakland Athletics’ pitchers, for example, had to cope with an MLB-high 272 post-error events. At the other end of the experience scale, Twins pitchers faced only 150 such events. The biggest reasons for that was the Twins’ fielders’ ability to avoid muffs. They committed just 78 errors all season, the fourth smallest number by any team.
The table below shows the performance of every team’s pitching staff immediately following an error. Data includes batting average, on base average and slugging percentage; teams are listed based on batting average. MLB averages for 2017 were .255/.324/.426.
Team BA OBA SLG
Minnesota Twins .343 .387 .536
Cincinnati Reds .327 .402 .613
Miami Marlins .322 .424 .452
Colorado Rockies .313 .401 .460
New York Mets .313 .396 .545
Seattle Mariners .310 .379 .584
Chicago White Sox .308 .366 .510
Texas Rangers .306 .388 .487
San Francisco Giants .302 .362 .533
Los Angeles Angels .291 .371 .443
Oakland A’s .281 .331 .443
Arizona Diamondbacks .275 .357 .441
Kansas City Royals .272 .344 .481
St. Louis Cardinals .270 .364 .418
Pittsburgh Pirates .267 .329 .524
Chicago Cubs .267 .358 .457
Toronto Blue Jays .265 .351 .453
Cleveland Indians .263 .331 .410
Tampa Bay Rays .262 .348 .399
Philadelphia Phillies .262 .326 .435
Milwaukee Brewers .260 .335 .498
New York Yankees .257 .314 .408
Detroit Tigers .250 .322 .381
Atlanta Braves .245 .321 .444
Washington Nationals .242 .326 .402
Los Angeles Dodgers .234 .311 .316
Baltimore Orioles .222 .285 .357
Houston Astros .221 .288 .304
Boston Red Sox .217 .265 .278
San Diego Padres .212 .292 .335
So, the next time someone tells you that an error on the field doesn’t affect baseball statistics, now you have the evidence to show that’s not true!
