Oakland Athletics: The franchise all-time bracket

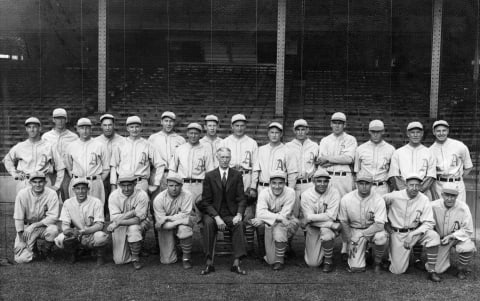
The Oakland Athletics have generated some of the best teams ever, with dynasties in the 1910s, 1920s, 1970s, and 1980s. Only one can emerge as the greatest.
The all-time Oakland Athletics bracket spans the coasts and throws some of the best teams in history into combat against one another.
The all-time franchise record is 400 games below .500, but don’t let that fool you. When the Athletics have been good, they have been great. The franchise has spawned at least four distinct dynasties, each deserving of at least one spot in the all-time bracket.
More from Call to the Pen
- Philadelphia Phillies, ready for a stretch run, bomb St. Louis Cardinals
- Philadelphia Phillies: The 4 players on the franchise’s Mount Rushmore
- Boston Red Sox fans should be upset over Mookie Betts’ comment
- Analyzing the Boston Red Sox trade for Dave Henderson and Spike Owen
- 2023 MLB postseason likely to have a strange look without Yankees, Red Sox, Cardinals
Begin with the early 1900s White Elephants of Connie Mack. For the American league’s first 15 seasons, this was the dominant team, winning pennants in 1902, 1905, 1910, 1911, 1913 and 1914.
Such a large bloc of quality should be worth two-bracket entries. Of the six, the 1910 and 1911 World Series winners had the best records, so they’re in.
Fast-forward to the late 1920s. Between 1929 and 1931, Mack’s second-generation Oakland Athletics won three straight pennants – by an average of 13 games – and averaged 104 wins in the process. The 1929 team won 104 games and the World Series. They fill a third slot.
Charlie Finley’s Swingin’ A’s of the early 1970s also won three straight, and they unfailingly included the World Series. At 94 wins, the 1973 club had the best record of the three; they receive the fourth spot in the bracket.
Between 1988 and 1990, the A’s again won three straight American League pennants, and they capped the 1989 season with a World Series title. That’s enough reason to make the 1989 team a fifth entry.
It’s impossible to think of the A’s without considering the Billy Beane era. Since becoming GM in the late 1990s, Beane has molded the A’s into 10-time post-season participants, although that version of the team has not yet played a World Series game. It did, however, top 100 wins in 2001 and again in 2002. Those records should be good enough to take the sixth and seventh spots.
As for the final slot, why not go with the 2019 A’s team? It won 97 games before losing in the American League wild-card round.
A’s: time to be delicate with pitcher A.J. Puk
More. A's: time to be delicate with pitcher A.J. Puk. light
The format is identical to previous bracket challenges. Each matchup in the tournament is decided based on seven criteria. You can think of each as a ‘game,’ the winner of four games advancing. The seven criteria are:
- Game 1: Regular season winning percentage.
- Game 2: Post-season winning percentage
- Game 3: Team OPS+
- Game 4: Team ERA+
- Game 5 (if necessary): Team WAR
- Game 6 (if necessary: Fielding percentage above the league average for the season in question.
- Game 7 (if necessary): Hall of Famers or likely future Hall of Famers
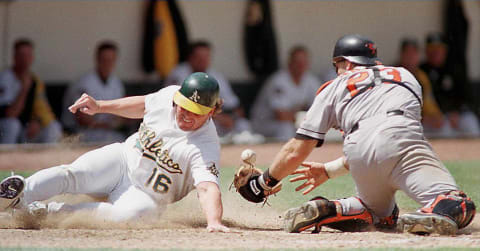
Oakland Athletics: The Franchise All-Time Bracket
No. 1 vs. 8 seed
How good were the 1929 Oakland Athletics? Good enough to bury the three-time defending champion Ruth-Gehrig Yankees by 18 games in the pennant race. Good enough to win the head-to-head series 14-8. Good enough to allow opponents 97 fewer runs than any other team, and 157 fewer than the Yankees allowed.
Begin with Lefty Grove. In 1929 Grove went 20-6 with a league-leading 2.81 ERA…this in a season when the average ERA was a point and a half higher. He also led in strikeouts with 170.
George Earnshaw added a 24-8 record and 3.29 ERA.
At the plate, the Athletics presented a star-studded lineup. Five A’s batted over .300, led by outfielder Al Simmons (.365), first baseman Jimmie Foxx (.354) and catcher Mickey Cochrane (.331), Simmons hit 34 home runs, Foxx 33 and they combined to drive in 275 runs.
The 2001 Athletics draw the unenviable task of taking on such a powerhouse. These A’s won 102 games and failed to win the AL West only because the Seattle Mariners rolled to 116 victories. It was a balanced ballclub led by first baseman Jason Giambi (.342 38 home runs, 120 RBIs).
On the mound, the trio of Tim Hudson, Mark Mulder, and Barry Zito combined for a 56-25 record in 104 starts embracing 680 innings.
Related Story. Detroit Tigers: The Franchise All-Time Bracket. light
Game 1: At 104-46, the 1929 team’s .693 percentage is too good, even for Beane and Giambi. The 2001 A’s won 102 games, but lost 60, a .630 percentage.
Game 2: The 1929 Athletics dispatched the Chicago Cubs in five World Series games. The 2001 A’s famously lost a five-game ALDS to Derek Jeter’s New York Yankees.
Game 3: Giambi’s 199 personal OPS+ leads the 2001 Athletics to a 107 team total, beating even the 1929 powerhouse’s 105.
Game 4: Behind Grove’s 149 ERA+, the 1929 team puts together a 122 staff ERA+. The 2001 A’s precisely match that. But their best individual performance, Hudson’s 129, is nowhere close to being on a par with Grove.
Game 5: This is a WAR matchup of titans. The 1929 team boasts an exceptional 56.4…but the 2001 A’s have an even more exceptional 57.1 total.
Game 6: The 2001 team fielded .980, but that was one percentage point worse than the American League average. The 1929 A’s fielded .975, and that was a full six percentage points better than the league average.
Result: 1929 A’s in six games
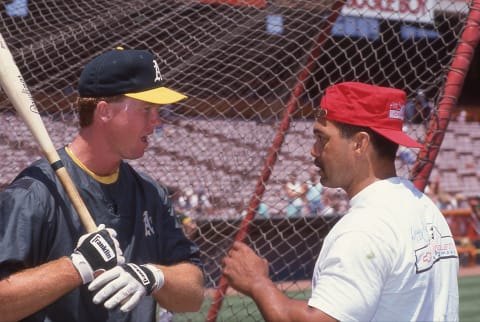
Oakland Athletics: The Franchise All-Time Bracket
No. 4 vs. 5 seed
Jason Giambi’s departure to free agency following the 2001 season encouraged the mindset behind ‘Moneyball.’ That’s the identity the 2002 team will always have. In fact, it won one more game than in 2001 and also won the division title before being upset by Minnesota in that fall’s division series.
Shortstop Miguel Tejada led the offense at .308, driving in 131 runs with 34 homers. Third baseman Eric Chavez also hit 30 homers, and he drove in 109 runs.
Hudson, Zito, and Mulder were back, this time producing a 57-21 record in 99 starts and 674 innings. Billy Koch closed 44 games.
In the mind’s eye, the 1989 A’s were led by The Bash Brothers’, Jose Canseco and Mark McGwire. The fact is that Canseco was injured much of the year, and while McGwire did produce 33 home runs the rest of his season was ordinary.
But third baseman Carney Lansford batted .336. Rickey Henderson stole 52 bases and DH Dave Parker delivered 97 RBIs.
On the mound, nobody was tougher than Dave Stewart, at 21-9 in 258 innings. Mike Moore added a19-11 record and 2.61 ERA in 242 innings, and Dennis Eckersley saved 33 games.
One fall earlier the Athletics appeared indestructible until running into the underdog Dodgers and Kurt Gibson. They took no such chances in 1989’s Earthquake Series, finishing off the National League champion San Francisco Giants in four straight.
Related Story. Minnesota Twins: The definitive franchise all-time bracket. light
Game 1: The 2002 team’s 103-59 .636 is four games better than the 1989 champions’ 99-63 .611 regular-season record.
Game 2: The 1989 team raced through its post-season with a near-perfect .889 winning percentage. The 2002 A’s lost three of five to New York.
Game 3: The 2002 A’s had a 106 team OPS+, just good enough to beat the 1989 club’s 104.
Game 4: Another close battle, this one involving the pitching staffs. The 1989 staff’s ERA+ was 119, one point improved on the 2002 team’s 118.
Game 5: The 20002 Athletics compiled a 52.7 team WAR. The 1989 A’s only got to 48.7 WAR.
Game 6: The 2002 A’s fielded .987, two points better than the league average. The 1989 team fielded .979, one point worse than that season’s AL average.
Result: 2002 in six games
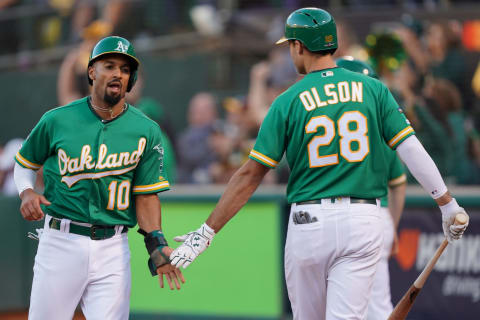
Oakland Athletics: The Franchise All-Time Bracket
No. 2 vs. 7 seed
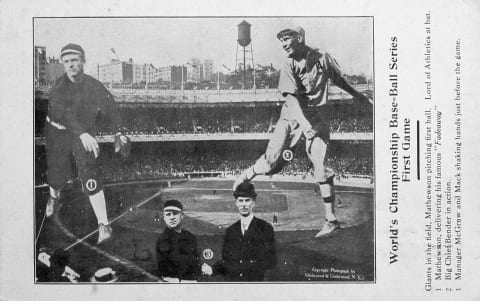
Connie Mack’s early A’s teams in Philadelphia are a challenge for any opponent. Although largely overlooked today, the 1910 club certainly fits that description.
Begin with the 102-48 record, good enough to win the pennant by 14 and one-half games. The A’s were a virtually unbeatable 57-19 at home.
As befitting such a team, they could both hit and pitch. The team .266 batting average led the league by five points. Second baseman Eddie Collins hit .324; outfielders Rube Oldring and Danny Murphy both also topped .300.
A’s pitchers compiled a 1.79 staff ERA, leading the league in that category as well as fewest hits allowed and most strikeouts. Jack Coombs went 31-9 with a 1.30 ERA in 353 innings, throwing 13 shutouts and striking out 224 opponents. Chief Bender was 23-5 with a 1.58 ERA.
The 2019 Athletics also had a deep pitching staff, especially after Sean Manaea (4-0, 1.21) returned from an arm injury and Frankie Montas 99-2, 2.63) completed a PED suspension. Mike Fiers went 15-4 in 33 starts.
Shortstop Marcus Semien led the offense with 33 home runs and 92 RBIs. Third baseman Matt Chapman added 36 homers and 91 RBIs, as did first baseman Matt Olson.
Related Story. Cleveland Indians: The franchise all-time bracket. light
Game 1: The 1910 team’s 102-48 record translates to a .680 winning percentage. In 2019, the A’s went 97-65 for a .599 percentage.
Game 2: The 2019 A’s lost their only post-season game in the AL wild card. The 1910 A’s beat the Cubs in a five-game World Series.
Game 3: The 1910 A’s display their strength by amassing a 113 team OPS+, five points better than the 2019 team’s 108.
Game 4: The 1910 A’s also have the superior pitching staff. Their 133 team-ERA+ is led by Coombs’ imposing 182. The 2019 A’s had a 109 ERA+.
Result: 1910 in four games
Oakland Athletics: The Franchise All-Time Bracket
No. 3 vs. 6 seed
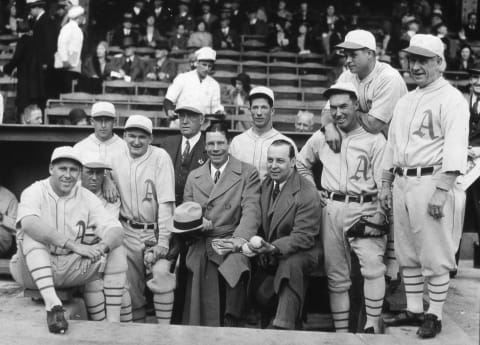
The 1973 Oakland Athletics were memorable both for their talent and for their characters, most of whom lived on a first-name basis. Think of Reggie, Rollie, Sal, Catfish, Blue Moon, and Vida. Catfish Hunter went 21-5 while Ken Holtzman, possibly the dullest of the lot, added a 21-13 record.
At the plate, Bill North stole 53 bases and Bert Campaneris added 34. But the A’s could hit as well as run. Jackson hit 32 home runs and drove in 117 runs, Bando added 29 homers and Gene Tenace 24.
They face the 1911 Athletics, a team similar in composition to the 1910 club.
In 1911 the A’s again breezed to the pennant, this time by 11 and one-half games, then finished off the National League champion New York Giants in six World Series games. At .365, Collins again led the offense, but he had lots of help from first baseman Stuffy McInnis (.321), third baseman Frank ‘Home Run’ Baker (.334) and outfielder Murphy (.329).
The 1911 Athletics batted .296 as a team, 23 points higher than the league average.
In 1911, Coombs went 28-12 in 40 starts and 337 innings, while Eddie Plank put together a 23-8 record and Bender went 17-5. Along with fourth starter Cy Morgan, they pitched nearly 80 percent of all the team’s innings.
Related Story. Chicago White Sox: The franchise all-time bracket. light
Game 1: The 1911 A’s went 101-50, a .669 regular-season percentage. The 1973 A’s had a 94-68 regular-season record, a.580 percentage.
Game 2: This is a meeting of world champions. The 1973 club had a.583 post-season record. The 1911 club’s post-season record was .667.
Game 3: The 1911 A’s had a 112 team OPS+, four points better than the 1973 team’s 108.
Game 4: The 1911 team sends its magnificent staff out in search of a sweep, but runs into an even better 1973 staff. Hunter, Holtzman, Blue, Odom, Fingers and the rest run up a 109 staff ERA+, four points better than the 191 club’s 105.
Game 5: The 1973 A’s had a 45.9 WAR. That’s an ordinary total for a championship club, and not good enough to stay with the 1911 team’s 52.4 WAR.
Result: 1911 in five games
Oakland Athletics: The Franchise All-Time Bracket
1929 vs. 2002
The 1929 Oakland Athletics of Mack, Grove, Foxx, Cochrane, and Simmons face a second Billy Beane team, this one the cash-strapped but uber-gutty 2002 team.
Game 1: The 1929 A’s 104-46 regular season record equates to a .693 winning percentage, the best in franchise history. The 2002 team can only get to 103-59 .636.
Game 2: Another win for a powerhouse 1929 club, with its .800 post-season percentage. The 2002 team played .400 ball in the post-season.
Game 3: In 2002, the A’s presented a 106 team OPS+, one point better than the 1929 club’s 105.
Game 4: The 1929 A’s, led by Grove, produced a 122 staff ERA+. As good as the 2002 pitching was, it only got to 118.
Game 5: The 1929 WAR of 56.4 beats 2002’s 52.7 and wraps up the series.
Result: 1929 in five games
Related Story. St. Louis Cardinals: The franchise all-time bracket. light
1910 vs. 1911
This is a battle of cousin powerhouses.
Game 1: In 1910, the A’s won 102 regular-season games for a .680 percentage. In 1911 they won 101, a .669 percentage. That’s a win for 2010.
Game 2: The 1910 A’s won the World Series in five games. It took the 1911 A’s six games. The series is 2-0 in favor of 1910.
Game 3: The 1910 team’s 113 OPS+ is one point better than 1911’ 112. The big differences are two role-playing outfielders: Bris Lord slips from 135 to 120, and Rube Oldring from 141 to 104.
Game 4: The 1911 staff had a 105 ERA+. The 1910 staff, one of the most dominant in baseball history, reached 133 in ERA+.
Result: 1910 in four games
Oakland Athletics: The Franchise All-Time Bracket
Championship
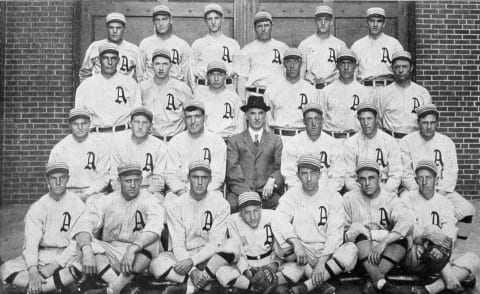
The all-time A’s bracket resolves itself down to two of the powerhouses of baseball history, both from the Philadelphia era.
More from Oakland Athletics
- Oakland Athletics: The 4 legends on the franchise’s Mount Rushmore
- 5 reasons for MLB owners to vote no on Oakland A’s move to Las Vegas
- Oakland Athletics: Jace Peterson, Sam Moll find new homes through trades
- MLB Trade Deadline: AL West roundup with Rangers, Angels, Astros wishlist, A’s and Mariners for sale
- Beane, Forst and the Oakland A’s front office: A mid-term grade for 2023
Game 1: The 1929 team’s .693 percentage is two games superior to the 1910s .680.
Game 2: Both A’s championship teams clinched their World Series wins in five games. This game is a tie.
Game 3: The 1920 team presents a 105 team OPS+. Bu the 1910 A’s had a 113 OPS+ that is the best in franchise history.
Game 4: The 1910 A’s not only had the best OPS+ in franchise history but they also had the best ERA+ in franchise history, at 133. The 1929 team’s 122 ERA+ can’t match that.
Game 5: The 1910 team presents an intimidating 59 WAR. Collins (6.6), Baker (6.4), Plank (6.3) and Bender (5.9) are the leaders The 1929 A’s present Simmons (7.9), Foxx (7.9), Grove (7.3) and Earnshaw (5.7). But their overall WAR only rises to 56.4, a superb total against all but the 1910 team.
Game 6: The 1929 team fielded .975, six points better than the .969 league average. That should be good enough, right? Not quite. The 1910 team fielded .965, nine points above the league average.
Next. Orioles: looking back at the 0-21 start to 1988. dark
Result: 1910 A’s in six games, one tie
The 1910 team was never taken to a seventh game, involving a headcount of Hall of Famers. For the record, it had four, not counting manager Connie Mack. The four were Collins, Baker, Bender, and pitcher Eddie Plank.